forum
library
tutorial
contact

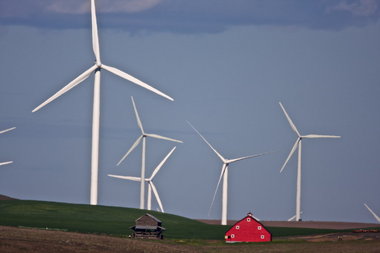
Winds of Change: How the Industry Can
Continue Wind Power's Boom Into the 2020s
by Herman K. Trabish
Utility Dive, September 1, 2016
|
the film forum library tutorial contact |
|
Winds of Change: How the Industry Can
by Herman K. Trabish
|
 Wind power is no longer an "alternative" source of energy. In fact, on many parts of the grid, it's the cheapest energy around.
In the windy regions of the U.S. interior, the average power purchase agreement (PPA) price for wind in 2009 was about $55/MWh; in 2015, it was about $20/MWh, according to a new report from Lawrence Berkeley National Laboratory (LBNL).
"That is competitive with the future expected cost of natural gas-generated electricity through 2040 and is competitive with current wholesale electricity prices," said LBNL Research Scientist Ryan Wiser, co-author of the 2015 Wind Technologies Market Report.
"The economic positioning of wind today, with the production tax credit, is extremely favorable and that is reflected in utility interest," Wiser added. He noted recent commitments by MidAmerican Energy for 2,000 MW of new capacity and Xcel Energy for a 600 MW build.
"The other big trend," he said, "toward corporate non-utility purchasers, is also indicative of the attractiveness of the low prices."
LBNL reports numbers that describe a mainstream source of power generation, including a cumulative installed capacity at the end of 2015 of 73.99 GW. Though still modest compared to the more than 500 GW of natural gas capacity in service, wind industry numbers "surged in 2015," LBNL reports.
Wind's low prices are due in part to the unexpected extension of a federal production tax credit at the end of 2015, which will gradually phase out over the next five years. Throughout that time, wind's growth is "projected to continue at a rapid clip," LBNL notes.
Given that foundation of incentives, the big questions in wind today are just how high the system penetration can get, and how low prices can drop.
The industry has already indicated, however, that beyond the five year horizon lie questions about whether the price can remain competitive, whether the U.S. bulk power system can continue to accommodate wind's variability, and whether solar will out-compete it.
Will the big build go on?
Prior to the tax credit extension, anticipation of subsidy sunsets at the end of last year drove investment dollars into deploying wind quickly. The industry's 8,598 MW of capacity additions in 2015 represented a total investment of $14.5 billion.
"The U.S. wind market raised approximately $6 billion of new tax equity in 2015--the largest single-year amount on record," LBNL reports.
"Debt finance increased slightly to $2.9 billion, with plenty of additional availability," the report adds. "Tax equity yields drifted slightly lower to just below 8% (in unlevered, after-tax terms), while the cost of term debt fell to just 4% by the end of the year--perhaps the lowest it has ever been."
Forecasts show expected capacity additions averaging over 8,000 MW per year from 2016 to 2020, LBNL reports. But they also suggest a potential downturn from 2021 to 2023.
The key factor in the potential downturn is the stepped phase-down of the PTC from its full $0.023/kWh value for projects which begin construction by the end of 2016 and go online by the end of 2020. It will be 80% of that value for projects that go into construction in 2017, then 60% for the next year, and 40% for projects that begin construction by 2019.
Adding to wind industry concerns are low natural gas prices, limited growth in electricity demand, slowing state renewables mandates, inadequate transmission infrastructure, and competition from utility-scale solar, LBNL adds.
Though roughly 51% of all wind capacity built from 2000 to 2015 has been through renewables mandates, only 24% of projects built in 2015 were driven by mandates, LBNL reports. Existing mandates are calculated to require roughly 3.7 GW per year through 2030, not all from wind, the report calculates. "These additions are well below the average growth rate in wind power capacity in recent years."
There are also factors that could drive robust growth through the early 2020s, the report points out, such as increases in post-2025 renewables mandates. How states choose to comply with the EPA's Clean Power Plan could also affect wind deployment, though the regulations face a court challenge this month and some analysts expect the current renewables buildout to make large wind additions in the 2020s unneccessary for compliance.
Those macro forces, however, are expected to be counteracted by continued price declines for wind PPAs.
First, new transmission is in the works. Though 2015's approximately 1,500 miles of new lines was a drop-off from previous years, there are 15 near-term transmission projects in some stage of planning that could deliver 52 GW of new wind capacity, LBNL noted.
Better technology is also expected to continue to drive costs down, according to "Wind Energy Costs & Cost Drivers," a survey of 163 of the world's foremost wind energy experts by U.S. Department of Energy and International Energy Agency experts.
Of 28 different drivers that could impact onshore wind's levelized cost of energy (LCOE), the experts expect advances in the size and power of the rotor that connects the turbine's blades to its powertrain to have the biggest effect. Technology advances should, the survey authors report, increase onshore wind's capacity factor and ultimately drive down the retail price.
The already emerging and potentially huge new customer class of non-utility off-takers could also drive growth as the price of wind becomes competitive, LBNL reports.
Can the system handle more wind?
In 2015, 45 GW of wind capacity was entered into U.S. transmission interconnection queues, the most since 2010 and second only to natural gas developers' 58 GW of added capacity. It brought wind's total capacity in queue to 110 GW, which was 31% of the capacity in the queues, again second to natural gas.
Construction and planning is gaining momentum, according to the second quarter 2016 market report from the American Wind Energy Association (AWEA). Over 3,000 MW of new construction were announced in the quarter, bringing the total capacity under construction to 12,450 MW, a 23% increase over the first quarter. Another 5,800 MW of capacity were in development and an additional 3,100 MW were announced.
Those numbers would appear to put wind on track to play a major role in the power mix, especially in the central U.S. where much of the capacity is expected to be added.
There are still barriers to managing high levels of variable generation, LBNL notes, but system operators are implementing new methods of integrating peak wind penetrations of 40% and higher at costs that are "almost always below $12/MWh--and often below $5/MWh."
There technical challenges in managing variability are real, but they are addressable and affordable, Wiser said.
Texas's 3,615 MW of new capacity in 2015 was the biggest state build for the year and brought its U.S.-leading cumulative installed capacity to 17,711 MW. Texas also has the most wind under construction in the country.
Integrating wind has not threatened reliability, according to Dan Woodfin, director of system operations for the Electric Reliability Council of Texas (ERCOT), the state's grid operator.
"We have been able to maintain reliability with the amount of wind we have and we expect to do so with the amount of wind that is planned," he told Utility Dive.
Variability can be mitigated by adding transmission to widen the available wind resource or by adding ancillary services to cope with fluctuations, Woodfin said. "We are not adding a lot of ancillary services as the amount of wind on the system has increased. The amounts we procured at the beginning of the year have covered the risks."
Standard planning shows ERCOT may need additional ancillary services in the foreseeable future, but not at present, said Sr. Manager of Transmission Planning Jeff Billo.
ERCOT did, however, approve new transmission capacity to deliver more panhandle region wind to the system as part of its standard long-term planning, Billo added.
Twelve states got to 10% or higher wind penetrations in 2015. Iowa got to 31%, South Dakota got to 25%, and Kansas got to almost 24%.
The Midcontinent Independent System Operator (MISO), the biggest of the U.S. organized grids and markets, includes several states with high wind penetrations. It has over 15,000 MW of wind capacity on its system and could have as much as 40,000 MW or more by 2030, according to Jordan Bakke, MISO's Policy Studies Lead.
"We are constantly evaluating what needs to be done to bring more wind onto the system and we can see we are not near any kind of limit for how much wind can be integrated," he told Utility Dive.
A recent filing with FERC to streamline its processing of interconnection requests demonstrates "there are always things that can always be improved, Bakke said. "If others' ambition is to build more wind in our footprint, our ambition is to add it to the system efficiently."
MISO's large footprint and economies of scale have mitigated any need to significantly modify operating reserve requirements to integrate its growing wind penetration, added Spokesperson Jay Hermacinski.
More generation supply tends to help reliability, he added. Despite deregulation, new organized markets, and an evolving generation portfolio over two decades, "the system is more reliable today."
Bakke stressed that MISO continues to monitor change on its the system. "We see increasing levels of coal retirements, increasing deployment of natural gas, wind, and solar, and an urgency to understand what transmission will be needed to accommodate all that change."
MISO uses a multi-layered planning process that includes multiple timelines and scenarios and its only conclusions so far are "directional," Bakke said.
Natural gas and renewables will replace coal retirements but only future natural gas prices, future policy, and the outcome of EPA regulations will determine the exact mix, he added.
"We are now trying to understand, given the direction we are going, if there is a limit to how much wind and other renewables we can add and if there is, what it is," Baake said. "We don't have an answer yet because there are so many variables. We are now asking what the variables are."
How low can prices go?
Though higher capacity factors, declining costs, and record-low interest rates drove wind PPA prices to unprecedented lows in 2015, wind's relative economic competitiveness declined because of a sharp drop in wholesale power prices, LBNL reports.
On the other hand, "the wind PPAs executed in 2014-2016 compare very favorably to the EIA's latest projection of the fuel costs of gas-fired generation extending out through 2040," the report adds.
Electric utilities continued to be the dominant off-takers, owning 12% and buying 48% of the new capacity installed last year. Merchant and merchant-like projects accounted for 29% the new capacity and direct retail purchasers such as corporate off-takers accounted for the other 10%.
Utilities now own 15% of all U.S. wind capacity and hold PPAs for another 53%. The merchant category accounts for 24%, power market players take 6%, and direct retail buyers are at 2% and growing significantly.
Average turbine nameplate capacity reached 2.0 MW in 2015, up 180% since 1998–1999 on new hub heights and rotor diameters, LBNL reports. New, higher powered machines have taken capacity factors to 32.8%, up from 30.3% in 2005. Yet the 2015 average installed project cost was approximately $1,690/kW, down $640/kW from the 2009-2010 peak.
The experts surveyed by the DOE/IEA researchers forecast a median LCOE reduction (from a 2014 baseline price) of "10% in 2020, 24% in 2030, and 35% in 2050."
An average 10% higher capacity factor and a 10% longer turbine life from technology advances are expected to be key factors. Those are projected to reduce the project capital cost by 12% and the project operating cost by 9%.
The obvious "significant uncertainty" in such forecasts is to some degree mitigated by the range of respondents to the survey, the paper notes.
In addition, the forecasts are "broadly consistent ... with four separate estimates of historical onshore wind LCOE," it adds.
In Texas, there's no question of wind's competitiveness.
When wind is high and demand is low on the ERCOT system, such as in the early morning hours, "prices have been very low because wind is setting the price," said Spokesperson Robbie Searcy. During much of a typical day, "natural gas is on the margin and determines the price."
There were times when low-price wind, constrained by a lack of transmission, caused negative pricing in low demand parts of the ERCOT market. With curtailment rates as high as 17% in 2009, project owners were willing to take a price below zero to be able to earn the balance of the $0.023/kWh tax credit.
The bulk of that market failure has been eliminated by the completion of $7 billion CREZ transmission system. Curtailment fell to 1% in 2015 because the new transmission is allowing high-demand markets to drive higher prices, LBNL reports.
Where it still occurs, that kind of market activity is not "an operational problem for ERCOT, though it could affect other generators," Searcy said.
MISO is seeing the same thing, Hermacinski said.
"Since wind is typically offered at low prices, it lowers overall prices by displacing less economic marginal units," he said.
Prices can be very low and even negative in areas where constraints prevent wind-generated electricity from flowing across MISO's footprint, he added. "During the high wind months of October to April in 2015-16, the energy prices in the Minnesota areas on average were approximately $4/MWh lower than the system-wide prices."
Wiser, who participated in the work on the LBNL survey of experts, nevertheless sees reason for caution.
"As the PTC phases down over the next several years, there is legitimate concern that the economic competitiveness of wind could be challenged," he said. Even with technology advances achieving the forecast lower installed cost, "if today's very low natural gas prices persist, it might be difficult for wind to compete after this current PTC cycle."
With the unprecedented stability the current PTC offers, any loss of competitiveness is at least five years out, he added. And forecasts of natural gas prices are notoriously unreliable.
"Most forecasts show natural gas prices rising over the next 5 years to 15 years, though the degree of the rise has declined, leaving some legitimate concern about a loss of competitiveness," he said.
Here comes the sun
Solar developers entered 24 GW of new capacity into U.S. transmission queues in 2015, third behind developers of natural gas and wind.
Discussions about solar's future, like those about wind, often center on how soon and how far prices will fall.
The price of onshore wind will decline 20% to 30% by 2025 and the installed cost for photovoltaic solar systems could fall 52% to 58% in the same time period, according to a recent assessment from the International Renewable Energy agency.
There is likely to be an average annual growth of 11.9 GW of wind capacity and 6.2 GW of solar capacity through 2020, according to a recent National Renewable Energy Laboratory study.
But some wind insiders say solar could catch up faster.
"There is already a regional threat to wind from utility-scale solar," Wiser said. "In the desert Southwest, solar competes with wind and, in many cases, is out-competing wind."
In Southeastern states like North Carolina and Georgia, where identified viable wind resources are limited, solar development is leading wind, he added. Developers in Texas expect solar to soon challenge wind. "As solar costs continue to fall, the number of regions in which wind and solar compete for market share will increase."
ERCOT's Billo sees increased interest in utility-scale solar. Projects with interconnection agreements and those under study total over 8,100 MW, he said. They could bring ERCOT's utility-scale solar capacity to over 1,900 MW by the end of 2017.
"Some scenarios in our 15 year planning models show solar as the dominant resource on the ERCOT grid," he said. "In those cases, coal generation and older natural gas plants retire and less new natural gas and wind infrastructure is built."
But solar output is highest from midday to late afternoon and wind is highest at night, ERCOT's Searcy pointed out. With the flexibility offered by new natural gas turbines, the three could effectively complement one another on the ERCOT system.
Flexibility is important, agreed Wiser. "And it can be accessed through natural gas plants, more flexible coal plants, and larger balancing areas in the near term, and through storage and other options in the longer term."
What is clear is that as renewables penetrations increase over the next few decades, "baseload inflexible generation will get rejected by the system as less valuable and more flexible generation will become more valuable," he said.
learn more on topics covered in the film
see the video
read the script
learn the songs
discussion forum
