forum
library
tutorial
contact
Economic & Environmental Impacts of the
Columbia-Snake River Extended Lock Outage
by Dr. Ken Casavant
Freight Policy Transportation Institute, August 2011
|
the film forum library tutorial contact |
|
Economic & Environmental Impacts of the
by Dr. Ken Casavant
|
Excerpt from report is below or click Full Report
2.1 Historical Waterborne Commerce on the Columbia-Snake River System, 1991-2010
 Waterborne commodity movements discussed in this study are based on the total arrival and departure estimates of commodities from the Bonneville Lock and Dam. Bonneville was selected because it is the last receiving lock on the Columbia-Snake River and the first lock that sends goods upriver. The total amount of downriver shipments from the Columbia-Snake River departs through Bonneville en route to other cities and the ocean for access to international markets. Similarly, for upriver shipments, Bonneville is the first lock to receive goods that then travel to subsequent locks of the Columbia-Snake River system as well as markets inland.
Between 1991 and 2010, about three times more tonnage traveled downriver than upriver on the Columbia-Snake River. Previous analyses of barge transportation on this river system suggest that this trend has been consistent for the last 30 years. Annual total tonnage traveling upriver remained quite stable between 1991 and 2010 at an average of 2.4 million tons, whereas the total tonnage of downriver shipments ranged from a high of 8.4 million tons in 1998 to a low of around 5.3 million tons in 2009 (Figure 2.1). As evident by the graph below, barge movements downriver have slowly decreased over the last ten years (2000 - 2010).
The downturn in shipments during the last three years is likely due to two factors:
Downriver Movements
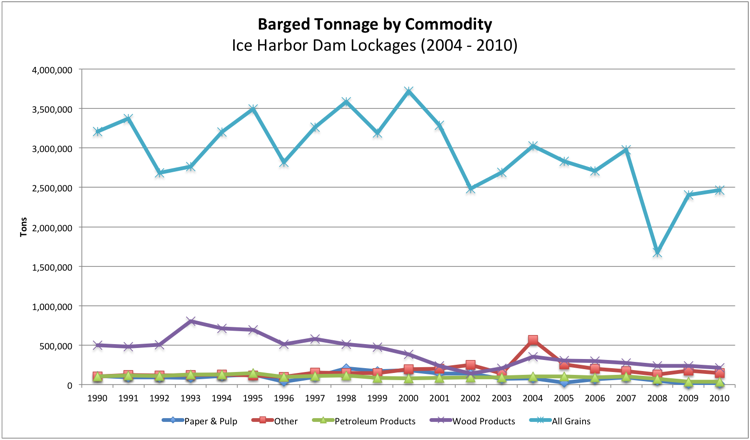 Annual and monthly downriver shipments have comprised 75 percent of all waterborne movements on the Columbia-Snake River for the last twenty years. A total of 142 million tons were shipped downriver between 1991 and 2010. The commodities with the largest volume of downriver shipments over the twenty year span between 1991 and 2010 have been (in descending order of their yearly tonnage) wheat; forest products, crushed rock products, grains other than wheat, vegetable products, processed grains and paper products. It is important to note that all of these commodities are agricultural outputs which are sent to the west coast to be used within the nation and internationally.
During this time period, wheat comprised about 70 percent, or 98 million tons of the total 142 million tons, of commodities transported downriver (Table A.1, Appendix A). The second highest commodity by total tonnage was forest products at about 18.9 million tons or 13 percent of downriver shipments.
Upriver Movements
As mentioned above, about three times less tonnage travels upriver than downriver. Therefore, only 48 million tons were shipped upriver between 1991 and 2010. The commodities with the largest volume of upriver shipments over the twenty year span between 1991 and 2010 have been gasoline, diesel fuel, landfill material, fertilizer and smelted products. As downriver commodities are generally outputs, these upriver commodities are in general agricultural inputs.
The highest proportion of total upriver shipments, about 41 percent or 19.6 million tons of the total 48.3 million tons, was attributed to gasoline (Table A.2, Appendix A). The second highest proportion of total upriver shipments was for diesel fuel, comprising 17.5 million tons (about 36 percent of the total upriver tonnage for 1991-2010).
. . .
Total Movements
 Major commodities in general moved in large and above average quantities on the Columbia- Snake River during the months of July through December 2010 in order to prepare for the extended lock outage. Those major commodities moving downriver that rose above average levels for at least two months include wheat, forest products, iron ore products, vegetable products, processed grains and agricultural products. Those major commodities moving upriver that rose above average levels for at least two months include diesel fuel and fertilizer.
These large shipments in the months leading up to December 2010 reveals that commodity industries were preparing for the extended lock outage by shipping more products prior to the closure date. By sending shipments prior to the outage, industries accumulated products in Portland, Oregon and Vancouver, Washington so that customers had easy access to shipping and international trade while the Columbia-Snake River was closed. Sending shipments early also allowed industries to fill orders prior to the outage rather than missing out on commerce and to avoid increased costs of alternate modes of transportation while barge transportation was curtailed.
Pacific Northwest Wheat
Since wheat is such a large volume client of barge transportation, 75 percent of all downriver movements, it is useful to pay particular attention to wheat and its movements in the Pacific Northwest prior to the lock outage.
The Pacific Northwest (Washington, Oregon and Idaho) has available a three pronged transportation system: rail, barge and trucking. Therefore, wheat (in particular soft white wheat) has three different potential modes of transportation, allowing wheat producers, elevators, shippers and carriers to select the most efficient and/or economical mode or modes of travel. In order to capture the options and decisions of wheat producers, elevators and shippers when it comes to wheat transportation, a survey of wheat elevators in the Pacific Northwest was conducted. This provided the baseline scenario so that possible changes brought on by the extended lock outage can be evaluated.
Once the results were compiled, the 26 firms interviewed were divided into specific regions of the Pacific Northwest. Idaho elevators were grouped into two regions, Northern (5 firms) and Southern (3 firms), by an imaginary line extending from Oregon's border with Washington. Washington was divided into Northern (5 firms) and Southern (8 firms) by I-90, a major highway through Washington. For example, the city of Wenatchee is north of I-90, so any elevators in that city would be considered Northern Washington. Oregon was simply grouped as Eastern Oregon since all 5 firms were located east of the Cascade Mountain Range, a common divider between the west and east sides of Oregon. Southern Washington, including the county of Whitman, ships the highest percentage of wheat in the Pacific Northwest. However, in general, Washington wheat elevators move 70 percent of all shipments from the three states (Figure 2.3).
Wheat firms in the Pacific Northwest move most of their product, about 61 percent, by truck- barge, due to the low cost and convenience of barge transportation. However, Northern Washington firms mostly employ rail to transport wheat, about 71 percent (Figure 2.4).
Thirty three percent of wheat coming from Southern Idaho and 14 percent from Northern Washington is shipped via truck to a final market (Figure 2.4). This could be because of the isolated nature of these regions or close proximity to flour mills, breweries and other facilities that process grain.
On average, truck-barge is at least 10 cents per bushel less than rail and truck. Direct truck to final market is the most expensive form of transportation in the Pacific Northwest at 89 cents per bushel and is seldom used (Table 2.3). Northern Washington and Southern Idaho are the only regions in which barge is more costly than both rail and truck.
| Region | Number of Firms | Direct Truck to Final Market | Truck-Barge | Rail |
|---|---|---|---|---|
| Eastern Oregon | 5 | $0.50 | $0.29 | $0.58 |
| Northern Idaho | 5 | $1.50 | $0.58 | $0.73 |
| Southern Idaho | 3 | $0.71 | $0.86 | $0.83 |
| Northern Washington | 5 | $0.52 | $0.57 | $0.54 |
| Southern Washington | 8 | $1.22 | $0.47 | $0.55 |
| Pacific Northwest | 26 | $0.89 | $0.55 | $0.65 |
| (bluefish adjusts for volume differences by region, Table 3.1) | $0.92 | $0.51 | $0.59 | |
Norhern Idaho and Northern Washington elevators both ship most of their wheat from December to March instead of August to November, in contrast to the rest of the regions.
For all regions besides Northern Idaho and Washington, the majority of wheat is shipped
. . .
According to the Washington State Department of Commerce, "petroleum companies [evaluated] all fuel supply points and distribution options throughout the region to ensure adequate supply and timely fuel deliveries to Eastern Oregon and Washington communities throughout the duration of the outage." Normally, fuels are barged from petroleum distribution terminals at Portland, Oregon and Pasco, Washington in order to supply eastern Washington and Oregon with petroleum. From Pasco, fuel is sent through the Chevron pipeline to Spokane, Washington for distribution or transported by tanker trucks to rural areas in eastern Washington and Oregon. The Washington State Department of Commerce and petroleum companies suggested three alternatives to barging 1.47 million gallons of fuel per day during the outage:
. . .
Ports
In addition to coordinating shipments and storage of commodities during the outage, the Port of Portland offered to reward shippers for their continued support and patronage by subsidizing rail and truck transportation. A Port of Portland commissioner stated that the port paid carriers $400 per container for truck and rail shipments from Lewiston, Idaho and $250 per container for truck and rail shipments from Umatilla, Oregon. To subsidize patrons' alternative transportation modes, the Port of Portland set aside $800,000. Port commissioners intended that the subsidy would encourage carriers and industries to continue business with Portland during and after the outage, instead of seeking commerce with other local ports.
. . .
Pacific Northwest Wheat, December 2010 - March 2011
The original survey served as a benchmark for volumes, rates and modal choices for wheat elevators in the Pacific Northwest during times in which barge, rail and truck transportation are all available. This second survey allowed comparison of normal volumes, rates and modal choices for wheat elevators to those during the extended lock outage.
During this period, Northern Washington shipped the highest percentage of wheat in the Pacific Northwest, over 57 percent (Table 2.5). This represents a shift in volume shipped; Southern Washington, including the county of Whitman, normally ships the highest percentage of wheat from the Northwest, about 35 percent. However, Northern and Southern Washington wheat elevators together moved 61 percent of all shipments from the three states during the lock outage, compared to 69 percent during a typical time period.
2.3 Industry Reactions to the Columbia-Snake River Extended Lock Outage, December 2010 - March 2011
The original survey served as a benchmark for volumes, rates and modal choices for wheat elevators in the Pacific Northwest during times in which barge, rail and truck transportation are all available. This second survey allowed comparison of normal volumes, rates and modal choices for wheat elevators to those during the extended lock outage.
During this period, Northern Washington shipped the highest percentage of wheat in the Pacific Northwest, over 57 percent (Table 2.5). This represents a shift in volume shipped; Southern Washington, including the county of Whitman, normally ships the highest percentage of wheat from the Northwest, about 35 percent. However, Northern and Southern Washington wheat elevators together moved 61 percent of all shipments from the three states during the lock outage, compared to 69 percent during a typical time period.
Eastern Oregon firms experienced a decline in shipments during the lock outage of 20 percent when compared to a typical winter's movements. Northern Idaho suffered a decline in percent decline in shipments of 86 percent during the lock outage, whereas Southern Idaho experienced a 32 percent decline in shipment volumes.
Most wheat firms in the Pacific Northwest moved the majority of their product, an average of 93 percent, by rail during the lock outage. However, Eastern Oregon and Southern Washington firms mostly employed trucking services to transport wheat from December 2010 to March 2010, about 40 to 75 percent, respectively (Table 2.6). Twenty percent of wheat coming from Eastern Oregon was shipped via truck-barge (Table 2.6). This was because of one wheat elevator's access to the Columbia River and Bonneville Lock and Dam to head to Portland. This lock was open 11 weeks during the 15 week outage.
Shipping rates for truck and rail increased slightly in the Pacific Northwest during the lock outage. Additional costs, such as investment in storage expansion and shipping from alternative sources, were incurred by several firms in varying amounts. Railcars were unreliable for some elevators during the lock outage which led to unforeseen costs, delays and potentially lost business; the magnitude was uncertain.
. . .
Industrial, Regional and Institutional Impacts from the Extended Lock Outage
Wheat
This industry was impacted, especially in Southern Washington, by the extended lock outage despite careful and methodical planning since 2009 on the part of regional wheat commissions, U.S. Wheat Associates, exporters, elevators and producers. Although most firms were able to work around the lock outage without too much difficulty, some firms called the outage a "nightmare."
Despite the large amount of wheat shipped by rail in the Pacific Northwest, elevators and exporters were not particularly happy with the service. One elevator manager commented, that "rail performance was terrible. Cars were ten days early in December and over 30 days late by the end of February and continuing through March." Another manager echoed this thought: "We could not wait for the river to open as there was lots of grain that needed to be moved. Trains were backed up quite a ways and/or arrived late in Portland [during the lock outage]."
Total shipment volumes in the Pacific Northwest decreased by about 1.6 million bushels during the extended lock outage from previous winters. However, during the summer and fall of 2010, wheat producers experienced high wheat prices due to increased demand for wheat. This increase was partially the result of a ban on Russian wheat exports due to a massive drought in Eastern Europe. Wheat producers in the Pacific Northwest jumped at the opportunity to sell their wheat at historically high prices and therefore, an above average volume of wheat was shipped by barge from August to November. September 2010 shipments downriver were 65 percent above 2007-2009 averages. Due to high prices and the need to move around the lock outage, many wheat elevators took the opportunity to ship prior to the outage.
Petroleum: Gasoline, Jet Fuel and Kerosene; Distillate, Residual and Other Fuel Oils; and Lubricating Oils and Grease
According to the Oregon Department of Energy (OED), petroleum companies shipped more than half of their product by tanker truck during the lock outage. It was stated that tanker truck is far more economical and convenient than transporting the commodity by rail. Tanker trucks used two routes; fuel was transported from refineries in the Seattle area to Eastern Washington via Interstate 90, a major highway system running through the middle of the state, and by way of highways on both sides of the Columbia-Snake River from Portland to various towns in Eastern Washington and Oregon. The ODE representative also stated that transportation of fuels to Eastern Washington and Oregon was "smooth sailing" since shippers, carriers and the petroleum industry had ample time to plan ahead. In addition, there were no reported fuel shortages, price gouging or price hikes due to the lock outage.
Forest Products, Lumber, Logs and Woodchips
Various paper companies in the Pacific Northwest moved almost 58,000 tons of forest products from December 2010 to March 2011 by truck and rail; less than 15 percent of this volume moved by rail. Most of these paper firms shipped forest products to their original destination during the lock outage, mainly to the Portland and Vancouver, Washington areas. One paper firm stated that woodchip shipments were being brought in by five trucks per day over the 15 week period. However, not all forest products were transported from the typical origin of Lewiston, Idaho and Boardman, Oregon. One paper company trucked local logs and woodchips, from the Portland area, to their facility in order to mitigate transit time and costs. Additional costs were incurred during the extended lock outage including an increase in inventory costs, storage costs and transportation costs.
Most barge companies temporarily laid off a significant number (from 35 percent to 67 percent) of their employees, including boat crews, in order to reduce costs. Some barge companies offered job sharing and reduced employees' work hours rather than lay off their entire staff. All of the barge lines were able to continue benefit packages for employees during the extended lock outage.
Rail Lines
In contrast to barge companies, which lost business for the majority of the lock outage, rail lines experienced an increase in cargo loads during the lock outage. Rail lines in the Pacific Northwest dealt with greater than normal volumes, additional products that would have moved by barge, increased crew numbers, additional days of operation and a few extra trains per week. Part of this experience included rail lines reaching out to industries that needed transportation during the outage and partnering with local ports to aid in the movement of products that would normally travel by barge.
Ports
The Port of Portland rewarded shippers for their continued support and patronage by subsidizing rail and truck transportation for industries that normally use barge to ship commodities to the Port. Port commissioners intended that this subsidy would encourage carriers and industries to continue business with Portland during and after the outage, instead of seeking commerce with other local ports. Indeed, no carriers or industry customers of the Port of Portland were lost to other local ports.
The Port of Portland set aside $800,000 to subsidize patrons' alternative transportation modes and only 48 percent of this total, or about $380,000 was used. This is evidence that most customers of the Port, both industries and carriers, either shipped goods prior to the lock outage or waited until the river was once again open to barge commodities.
. . .
2.4 Return of Barge Traffic to the River, April - June 2011
The commodity movements in the three months following the extended lock outage reveal how shippers and carriers instantly responded to the reopening of the lock system. Three alternative options were available to move products with the absence of barge: 1) increase barge movements prior to December 2010, 2) ship products by truck and rail during the lock outage and/or 3) increase barge movements after March 2011. The third alternative is evident in the data discussed below.
The most notable characteristic is that the traffic has returned with major surges above past movement levels; this is especially true in movements downriver. Between April 2011 and June 2011 about five times more tonnage traveled downriver than upriver, compared to the typical three to one movement. Analyses for the last 30 years (see references) of Columbia-Snake River transportation found that three times more tonnage consistently traveled downriver than upriver. The fact that downriver traffic increased relative to upriver traffic during this three month period suggests that industries that ship products downriver were more impacted by the lock outage as these entities chose to heavily transport commodities after the lock outage rather than during. Also, monthly total tonnage traveling both downriver and upriver gradually decreased from high tonnages in April to mostly below average volumes in June. The downriver high in April was likely due to wheat elevators' commodity shipments following the lock outage as many managers chose to immediately ship wheat after the lock outage was complete and barge transportation was an option again.
Downriver Movements
A total of 2.4 million tons were shipped downriver between April and June 2011. The commodities with the largest volume of downriver shipments over the three month period were wheat, forest products, crushed rock products, iron ore products and vegetable products. During this time period, wheat comprised 80 percent, or 1.9 million tons, of the total downriver 2.4 million tons (Table A.7, Appendix A). The second highest commodity by total tonnage was forest products which comprised 11 percent of the three month period's volume.
Upriver Movements
Around 514,000 tons were shipped upriver between April and June 2011. The commodities with the largest volume of upriver shipments over the three month span were diesel fuel, gasoline, landfill materials, fertilizer and crushed rock products.
The highest proportion of total upriver shipments, 43 percent or 219,000 tons of the total 514,000 tons, was distillate, residual and other fuel oils (Table A.8, Appendix A). The second highest proportion of total upriver shipments was gasoline, jet fuel and kerosene products, comprising 150,000 tons (about 29 percent) of the total upriver tonnage for April through June.
Total Movements
Major commodities in general moved in near and above average quantities on the Columbia- Snake River during the months of April through June 2011 in order to ship products that had been halted by extended lock outage. Those major commodities moving downriver from April to June 2011 that rose above average levels for at least two months include forest products and wheat. Those major commodities moving upriver that rose above average levels for at least two months during this time period include fertilizers and primary non-ferrous metallic products.
Pre and Post Lock Outage Barge Movements
 Commodity movements prior to and after the extended lock outage were also examined as to determine whether industries were able to effectively reconfigure commodity shipments that would have shipped by barge during the extended lock outage. Historic monthly averages for the three months prior to and after the lock outage, September through November and April through June, respectively, are compared to the actual monthly tonnage for those months in 2010 and 2011.
The information presented in this section only examines downriver movements since shipments in the westward direction make up over 75 percent of annual waterborne shipments in both directions. In addition, monthly total tonnages and monthly wheat tonnages will be the only volumes examined in order to simplify discussion.
During the three months before the lock outage on the Columbia-Snake River, monthly total shipments downriver were significantly higher than corresponding historic averages. Likewise, total monthly downriver wheat shipments were significantly higher than their corresponding historic averages. September 2010 downriver shipments of wheat were a remarkable 65 percent above average (Figure 2.6). Shipments of wheat in October 2010 were 80,000 tons above average or an increase of 20 percent. Lastly, downriver wheat movements in November 2010 were 27 percent above average.
These significantly above average movements show that industries and shippers were prepared to ship their products prior to the lock outage as to avoid additional time and expenses to ship commodities by rail or truck during the lock outage. The wheat industry in particular shipped above average shipments prior to the lock outage; during this time wheat producers experienced high wheat prices due to increased demand for wheat. This increase was partially the result of a ban on Russian wheat exports due to a massive drought in Eastern Europe. Wheat producers in the Pacific Northwest jumped at the opportunity to sell their wheat at historically high prices. Barge transportation in this industry is the most economical mode of transportation and overseas buyers expected wheat shipments to be on time despite the transportation disruption; these three factors lead to many wheat elevators' decision to ship early and often prior to December 2010 as to build up inventories in exporters' houses and to satisfy wheat orders overseas.
After the lock outage, during the months of April through June 2011, monthly total shipments downriver were significantly above average for April and May, but below average for the month of June. Total monthly wheat movements made downriver, however, were above average for all three months following the lock outage. In April 2011, total wheat shipments moving downriver reached 758,000 tons and were a significant 118 percent above the 2007-2009 April average (Figure 2.7). Total wheat shipments during the month of May were 84 percent above average. Finally, June 2011 shipments of wheat downriver were also above average by 88 percent.
This surge in shipments during the two months after the lock outage is evidence that industries waited to transport their goods until after the lock outage rather than during. This is likely due to the fact that barge transportation is more economical and more convenient for those industries that regularly use waterborne transportation. In addition, wheat shipments following the lock outage were notably larger than normal; this shows that the wheat industry chose to either ship prior to the lock outage or to transport goods after the lock outage ended. This is logical as barge transportation is substantially less expensive than rail and truck. During the lock outage, those elevators in the wheat industry that regularly use barge transported an insignificant volume by truck and rail; these volumes totaled about 45,500 tons (Interim Report #3). It appears that since the wheat industry prepared so well for the lock outage, elevator managers did not need to ship as much grain during the lock outage and were able to wait until the lock system reopened.
. . .
3.1 Economic Impacts of Commodity Industries
. . .
Wheat
. . .
During a typical August through November time period, the wheat industry incurs total shipping costs of $82.6 million. Trucking costs amount to $5.5 million, barging costs $49.9 million and rail costs $27.2 million (Table 3.2). The average rate for truck transportation is $0.89 per bushel; the rate for barge is $0.52 per bushel and $0.63 per bushel for rail. Clearly, barge transportation is essential to the Pacific Northwest as typically 69 percent of shipments from August to November move by barge according to those firms surveyed (Table 3.2).
4.5 Conclusions for Energy Consumed and Emissions Produced Due to the Lock Outage
. . .
Study Conclusions
. . .
Wheat shipment costs during the year of the lock outage were 37.4 percent more than during a typical year. Costs increased the most during the December 2010 to March 2011 time period; shipping costs increased by 67.4 percent during this time period. However, because a typical year of wheat shipments is drastically different than the year of the lock outage, cents per bushel for each year was calculated to show the actual difference in costs. During a typical year, wheat costs $0.48 per bushel to transport compared to $0.54 per bushel during the lock outage. Consequently, the cost of wheat transportation per bushel rose by six cents or only 12.7 percent during the year of the lock outage. Calculating cost per bushel allows the author to erase the influence of the large export year of 2010-2011.
In addition, energy consumed by truck and rail transportation increased and barge energy consumed decreased with the lack of river access during the lock outage. The overall result in energy intensity during the year of the lock outage was an increase of 10 percent more Btu's consumed. This increase in energy use is logical as more tonnage was shipped from August 2010 to July 2011 than during a typical year and truck was mostly used to replace barge during the lock outage, which is more energy intense. However, energy consumed per ton decreased 4.8 percent due to the heavy use of rail, which is more energy efficient than barge or truck, and the increased use of barge prior to and after the lock outage.
Along with energy consumption, emissions production also increased due to the lock outage. The total change in emissions due to the loss of barge during the lock outage caused a 9 percent increase in overall emissions from the transportation commodities. Percentages of hydrocarbons, carbon monoxide, nitrous oxides and particulate matter all increased; sulfur oxides were the only emissions component to decrease. Again, the general increase in emissions is a result of the increase in tonnage shipped and alternative modes used during the lock outage year in comparison to a typical year. Rail produces more emissions, including all components, when compared to barge. Truck produces more hydrocarbons and particulate matter when compared to barge. Therefore, the general increase in emissions during a transportation disruption like the extended lock outage is logical and expected.
The manner in which this major disruption of the river system was handled resulted in "fears not being realized." The impact was modified by the higher wheat prices in 2010 and early 2011 due to a Russian export ban on wheat, which helped generate increased shipments prior to the outage. Additionally, the communications that occurred among shippers, ports, carriers, and shipper representatives and especially the USACE resulted in as free-flowing a transportation system as was possible during this critical time.
Related Pages:
Adjustments to Tables 3.2, 3.3 and 3.4 Excel spreadsheet by bluefish
learn more on topics covered in the film
see the video
read the script
learn the songs
discussion forum
