forum
library
tutorial
contact

Montana Grain Tonnage
Barged on Lower Snake River
Montana Wheat & Barley CommitteeCalendar Years 1985-2001
|
the film forum library tutorial contact |

|
Montana Grain Tonnage
Montana Wheat & Barley Committee |
| Montana Wheat Production | | | Montana Barley Production | |||||
|---|---|---|---|---|---|---|---|
| Year | Barged | Total | % Barged | | | Barged | Total | % of Total |
| 1985 | 305,855 | 2,195,697 | 13.9% | | | 4,350 | 573,250 | 0.8% |
| 1986 | 6,109 | 2,126,125 | 0.3% | | | 18,587 | 783,878 | 2.4% |
| 1987 | 250,802 | 3,679,842 | 6.8% | | | 68,662 | 1,124,494 | 6.1% |
| 1988 | 213,710 | 3,393,679 | 6.3% | | | 6,549 | 1,172,965 | 0.6% |
| 1989 | 144,972 | 2,629,373 | 5.5% | | | 13,577 | 756,476 | 1.8% |
| 1990 | 119,430 | 3,299,865 | 3.6% | | | 10,962 | 1,000,100 | 1.1% |
| 1991 | 177,888 | 3,628,168 | 4.9% | | | 4,682 | 587,470 | 0.8% |
| 1992 | 210,508 | 3,729,334 | 5.6% | | | 2,106 | 765,270 | 0.3% |
| 1993 | 239,684 | 4,107,607 | 5.8% | | | 1,102 | 730,776 | 0.2% |
| 1994 | 419,491 | 4,918,125 | 8.5% | | | 17,373 | 1,034,945 | 1.7% |
| 1995 | 239,054 | 4,989,066 | 4.8% | | | 10,014 | 906,312 | 1.1% |
| 1996 | 199,082 | 4,487,163 | 4.4% | | | 11,016 | 815,510 | 1.4% |
| 1997 | 132,437 | 3,734,006 | 3.5% | | | 5,341 | 615,313 | 0.9% |
| 1998 | 163,991 | 4,134,403 | 4.0% | | | 1,717 | 589,150 | 0.3% |
| 1999 | 156,804 | 4,117,470 | 3.8% | | | 5,081 | 727,066 | 0.7% |
| 2000 | 168,186 | 4,081,544 | 4.1% | | | 1,589 | 561,256 | 0.3% |
| 2001 | 104,953 | 3,229,626 | 3.2% | | | 493 | 508,688 | 0.1% |
| 1985-2001 Average |
191,350 | 3,675,358 | 5.2% | | | 10,777 | 779,583 | 1.4% |
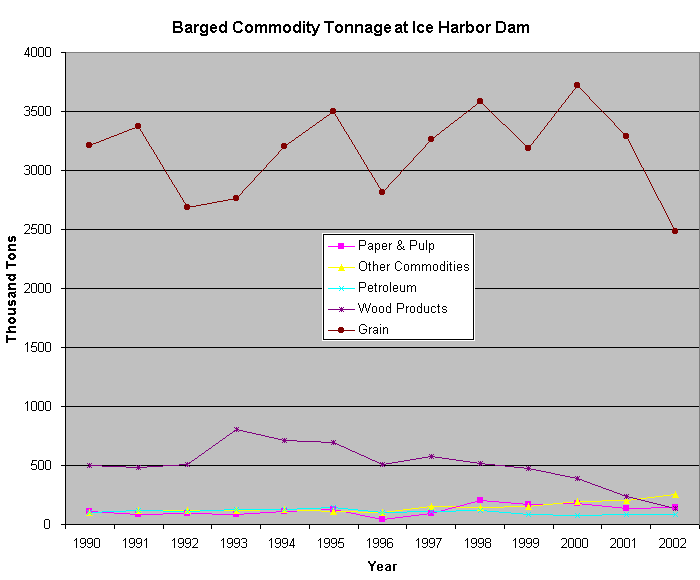
Notice Data above is in Metric Tons (2205 pounds) while graph below is in Tons (2000 pounds). Regardless, Montana grain makes up a relatively small portion of the total grain barged down the Lower Snake River.


 Source of Data (Montana Wheat & Barley Committee):
All Montana Wheat & Barley Movement by Truck & Rail
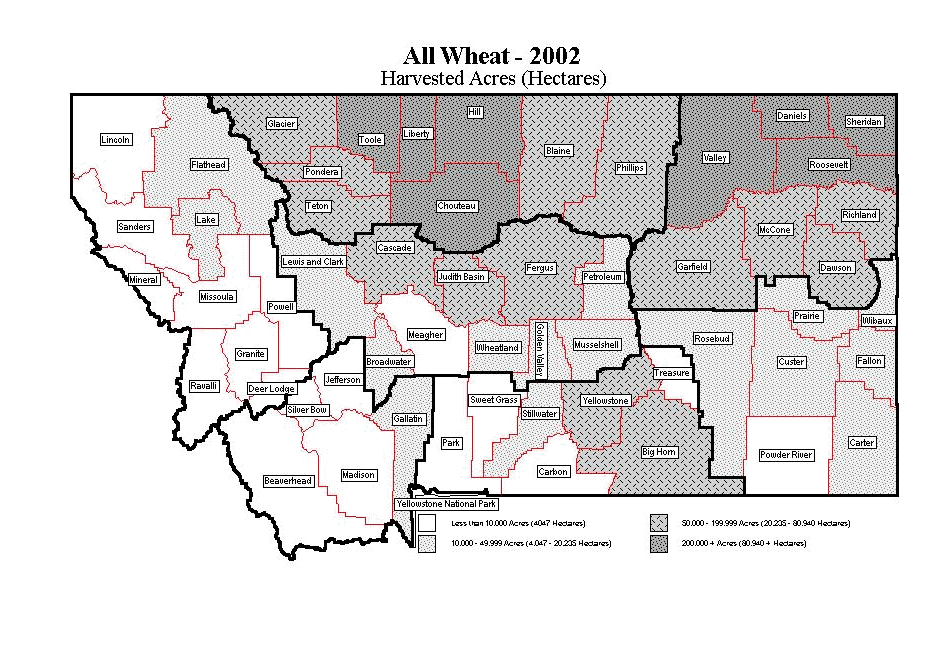
Montana Grain Movement- All Wheat
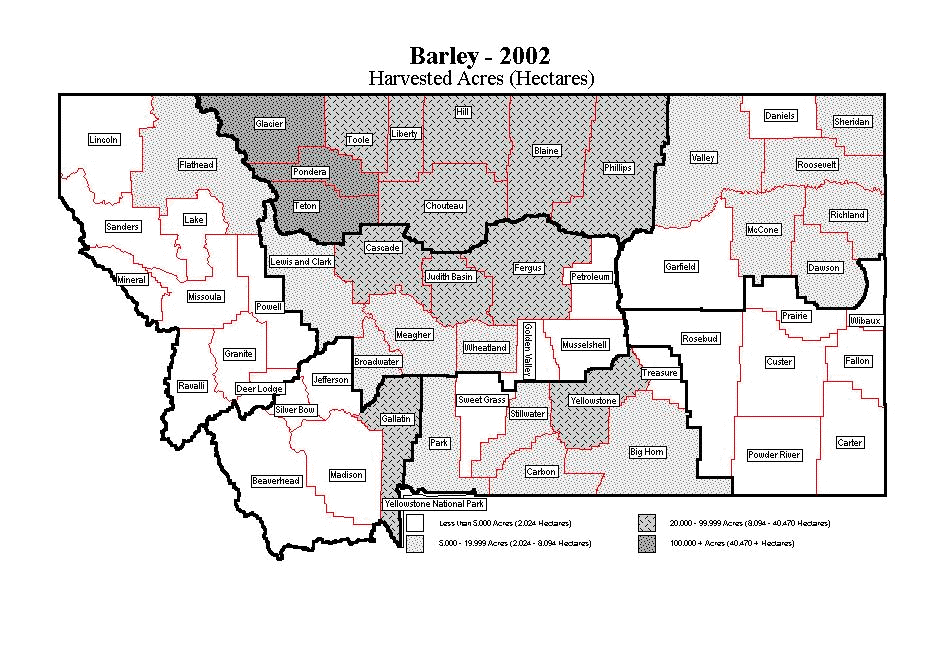
Montana Grain Movement- Barley
Montana Wheat & Barley Committee
Montana Grain Tonnage Barged on Lower Snake River
Data compiled from 1985-2001
learn more on topics covered in the film
see the video
read the script
learn the songs
discussion forum
