forum
library
tutorial
contact

The Wet and Wild West: Northwest
Hydro Sets Record Levels This Year
by Kassia Micek
Renewable Energy World, June 27, 2017
|
the film forum library tutorial contact |

|
The Wet and Wild West: Northwest
by Kassia Micek
|
 There is water, water everywhere with plenty to spare in the West this year.
Hydro generation has risen to new levels on near-record winter snowfall, which has pulled down power prices into negative territory and cut back usage of other generation sources.
Grand Coulee Dam has been supplying power to the Northwest for decades. Check out this 1941 Woody Guthrie song that tells of its beginnings. The Bonneville Power Administration commissioned Guthrie to write a collection of songs known as "The Columbia River Songs" about the benefits new federal hydroelectric dams would bring to the people of the Northwest.
I wonder if Guthrie had any idea what Grand Coulee would do 76 years later.
In May, Grand Coulee Dam power generation averaged 3,738 MW, up 48% from the May 2016 average of 2,531 MW, according to US Army Corps of Engineers data. And that number is only growing.
As of June 15, power generation averaged 4,534 MW, up 54% from the June 2016 average of 2,943 MW.
Inflows at Grand Coulee Dam peaked at 290.2 kcfs (that's thousand cubic feet per second) on June 2, which is well above the 10-year average of 191.65 kcfs, according to data from the US Army Corps of Engineers and University of Washington Columbia Basin Research.
At The Dalles Dam, the April-September water supply forecast has started to fall from a season high of 132% of normal reached June 5, according to the Northwest River Forecast Center. For comparison, the forecast averaged 91.5% last June.
Currently, 2017 ranks as the 10th highest year since record keeping began in 1960. In 2012, the last time BPA had to curtail non-hydro generation to maintain system reliability, the level reached 134% of normal and ranked that year as sixth highest, while 2011 is ranked as fourth highest at 143%.
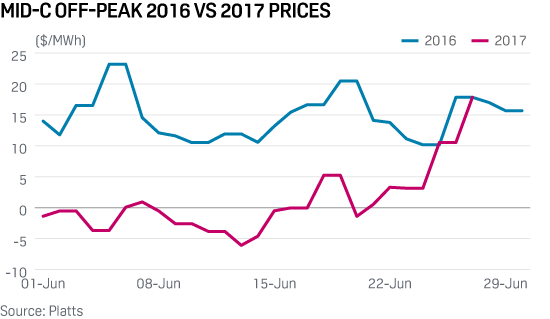
With so much hydro generation available, Mid-C dailies have been pulled into negative territory.
Mid-C on-peak day-ahead dropped to negative 73 cents/MWh on April 1 -- and it wasn't an April Fools' joke, but the lowest level in more than 20 years. So far in June, Mid-C on-peak day-ahead is more than 29% below the June 2016 average, with off-peak nearly 99% below a year ago. Off-peak has averaged 26.5 cents/MWh this month and fallen as low as negative $6.09/MWh.
All that hydro generation has led to a reduction in other generation sources.
BPA has been managing an oversupply of hydro generation since March, the earliest it has had to do so in its history. Through its Oversupply Management Protocol, non-hydro generation is displaced to maintain system reliability
BPA has already curtailed 139 GWh of generation so far this year through June 18, which is a new record. In 2012, curtailments totaled 51 GWh, while 109 GWh was curtailed in 2011. In both 2011 and 2012, curtailments went through July, according to BPA data.
Across BPA, hydro generation has averaged 315,361 MWh/d so far this month, up 51% from last year, according to BPA data. Wind generation has averaged 33,950 MWh/d, down 18% from last June.
The increase in hydro has pushed the thermal generation share of the fuel mix to a fraction of last year, down 84% year on year to average 8,468 MWh/d.
From May 13-June 19, the 1,190-MW Columbia nuclear reactor in Richland, Washington, was offline for a refueling and maintenance outage. BPA June power generation
It's a similar story in California, which is also experiencing an influx of hydro this year on top of an already flourishing solar and wind fleet.
SP15 on-peak day-ahead reached as low as $6.17/MWh on June 6, one of the lowest levels in years. For comparison, on-peak averaged $33.12/MWh last June and $58.81/MWh from 1999-2014, according to Cal-ISO data.
Thermal generation is down 20% year on year, reaching the lowest level since at least 2010, when it dipped to 44,587 MWh/d on June 11, according to Cal-ISO.
Meanwhile, month-to-date solar generation is up 37% year on year to average 120,945 MWh/d, according to Cal-ISO data. Wind generation is 3% higher than last June, averaging 57,395 MWh/d this month.
Additionally, hydro generation is up 26% from last June as the Shasta Dam water supply is now at 168% of average, according to the California Nevada River Forecast Center.
However, as summer temperatures start to spike and demand rises, the region will begin to use its stored water supply, and officials expect things to return to normal when the new water year begins in October.
learn more on topics covered in the film
see the video
read the script
learn the songs
discussion forum
