forum
library
tutorial
contact
How Too Much Wind Power
Could Actually Hurt Salmon
by Dan TilkinKATU News, November 5, 2008
|
the film forum library tutorial contact |
|
How Too Much Wind Power
by Dan Tilkin |
... right now we actually have enough electricity to meet demand in the Northwest
but excess green power produced here can't just be sent back east.
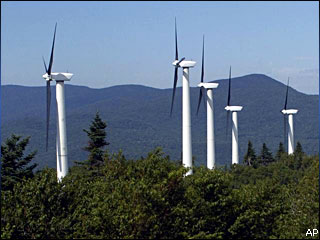 COLUMBIA RIVER GORGE - Wind turbines are the hottest rage in 'going green' but the technology has a dangerous side for endangered salmon in the Columbia River.
No one is saying wind power is bad by any stretch - it will play a huge role in producing sustainable, green energy.
For example, the new Rattlesnake Road Wind Farm at the eastern end of the Columbia River will produce enough power to light 30,000 homes and will prevent the annual emission of 70,000 tons of carbon dioxide, which is equivalent to taking 7,000 cars off the road.
And the blueprint for wind energy in the Northwest, known as the Wind Integration Plan, calls for even more wind power online by 2009.
But while all that sounds great, it is important to understand that there are serious concerns to consider.
You see, when the wind is really blowing and the farms are operating at maximum capacity, the present system will not be able to handle all of that electricity, which ultimately affects fish.
 This isn't just a theory - it actually happened recently. At the end of June, there was an unexpected surge in wind power and too much energy was created for the regional grid to handle. To compensate, the dams cut their power by spilling more water.
Spilling more water is dangerous for fish because water plunging from the dams into the river becomes saturated with air. Air is mostly nitrogen and salmon do not like nitrogen saturation.
"I think it caught us just a little bit off guard because the rate of growth of wind has been so fast," said Elliot Mainzer with the Bonneville Power Administration. He's in charge of strategies for balancing the electricity needs and supplies of the future.
Part of the problem is that right now we actually have enough electricity to meet demand in the Northwest but excess green power produced here can't just be sent back east.
That's because the electrical grid in the Western United States has little connection to the rest of the country.
In August, the Bonneville Power Administration asked gas and coal-fired facilities to look at 'generation increases or generation decreases.' In short, they asked if the facilities would be willing to produce less power when wind turbines are producing at high levels.
The rub with that is that anyone who owns a coal or gas-fired electricity plant made a huge investment and is essentially being asked to cut their income.
However, the Bonneville Power Administration is trying to broker a deal where the wind industry can compensate their greenhouse gas-producing competition for lowering their production.
The hope is that they'll be able to lower the strain on the electrical grid, which in turn will lower the strain on fish.
"The last thing we ever want to see happen is a reliability event on our system where it truly compromises our ability to implement the fish protection measures," said Mainzer. "That is a very bad outcome, so I would say to their credit they have been coming to the table and are prepared to work with us on the solutions to these issues."
In the long run, green power is good for everyone and it's even mandated by law. In Oregon, the state's largest utilities must get 25 percent of their electricity from renewable sources by 2025. In Washington, it's 15 percent by 2020 and in California, it's 20 percent by 2010.
But keep in mind that hardly any new transmission lines have been built in the last 15 years.
Outflow is flow rate through turbines for power production.
| Date | Monitoring Stations | |||||||||||||||||
|---|---|---|---|---|---|---|---|---|---|---|---|---|---|---|---|---|---|---|
| LWG | LGNW | LGSA | LGSW | LMNA | LMNW | IHRA | IDSW | MCNA | MCPW | JDY | JHAW | TDA | TDDO | BON | CCIW | WRNO | CWMW | |
| Gas Cap % | 115 | 120 | 115 | 120 | 115 | 120 | 115 | 120 | 115 | 120 | 115 | 120 | 115 | 120 | 115 | 120 | 120 | 115 |
| 06/01/2008 | 106.0 | 127.0 | 121.5 | 122.0 | 123.2 | 124.1 | 120.2 | 123.3 | 115.9 | 122.0 | 113.8 | 119.7 | 112.7 | 117.8 | 114.5 | 123.4 | --- | 118.3 |
| 06/02/2008 | 105.6 | 128.3 | 120.5 | 123.5 | 122.4 | 121.4 | 119.1 | 122.8 | 114.4 | 121.8 | 114.1 | 119.5 | 114.1 | 118.2 | 114.4 | 124.9 | --- | 120.1 |
| 06/03/2008 | 106.0 | 127.4 | 120.6 | 124.1 | 125.0 | 123.3 | 119.5 | 123.8 | 113.2 | 122.3 | 113.8 | 121.1 | 115.2 | 121.7 | 118.5 | 124.3 | --- | 120.1 |
| 06/04/2008 | 105.2 | 125.6 | 120.8 | 124.5 | 124.4 | 124.8 | 120.2 | 124.0 | 112.3 | 122.8 | 110.3 | 124.8 | 115.1 | 119.2 | 116.4 | 123.7 | --- | 120.0 |
| 06/05/2008 | 104.9 | 124.8 | 119.7 | 121.5 | 123.9 | 121.4 | 120.2 | 121.8 | 114.9 | 122.6 | 110.4 | 120.0 | 112.6 | 117.9 | 116.2 | 124.0 | --- | 118.8 |
| 06/06/2008 | 104.6 | 123.6 | 119.2 | 119.0 | 122.2 | 121.4 | 118.0 | 120.6 | 113.7 | 121.1 | 110.3 | 119.5 | 111.4 | 117.0 | 113.2 | 123.5 | --- | 117.2 |
| 06/07/2008 | 104.0 | 123.4 | 115.7 | 117.9 | 116.4 | 117.6 | 114.7 | 119.6 | 110.0 | 119.8 | 110.0 | 118.7 | 110.7 | 116.6 | 112.5 | 121.9 | --- | 115.6 |
| 06/08/2008 | 103.5 | 121.0 | 115.0 | 116.4 | 116.6 | 117.3 | 114.7 | 118.6 | 111.2 | 120.1 | 108.7 | 119.3 | 111.2 | 116.6 | 112.5 | 123.1 | --- | 116.2 |
| 06/09/2008 | 104.7 | 120.9 | 116.2 | 117.0 | 117.1 | 119.1 | 116.7 | 119.0 | 113.4 | 118.9 | 108.9 | 117.6 | 111.0 | 116.9 | 113.9 | 124.3 | --- | 116.5 |
| 06/10/2008 | 104.7 | 119.3 | 114.3 | 117.5 | 114.3 | 120.4 | 113.8 | 120.4 | 110.6 | 119.8 | 107.6 | 119.2 | 108.9 | 117.0 | 110.6 | 123.7 | --- | 111.0 |
| 06/11/2008 | 103.2 | 122.9 | 111.7 | 120.9 | 113.7 | 121.5 | 112.5 | 123.7 | 108.6 | 121.1 | 106.0 | 122.4 | 112.3 | 117.8 | 111.0 | 121.9 | --- | 114.6 |
| 06/12/2008 | 103.1 | 122.4 | 111.8 | 120.5 | 117.5 | 120.8 | 114.4 | 120.0 | 112.8 | 122.9 | 105.2 | 122.6 | 113.7 | 119.1 | 113.3 | 124.3 | --- | 118.7 |
| 06/13/2008 | 105.0 | 120.1 | 115.0 | 120.1 | 119.3 | 122.1 | 117.8 | 121.9 | 116.0 | 121.6 | 108.4 | 120.3 | 112.7 | 119.1 | 115.3 | 122.9 | --- | 120.1 |
| 06/14/2008 | 105.2 | 113.5 | 116.6 | 116.5 | 119.2 | 120.9 | 119.2 | 117.6 | 117.8 | 119.8 | 110.8 | 118.8 | 111.8 | 117.3 | 114.1 | 123.4 | --- | 117.7 |
| 06/15/2008 | 105.3 | 113.3 | 115.4 | 115.5 | 117.7 | 120.4 | 118.8 | 119.3 | 117.1 | 119.3 | 115.8 | 119.1 | 113.5 | 118.0 | 112.2 | 122.7 | --- | 116.8 |
| 06/16/2008 | 105.2 | 119.3 | 112.1 | 115.6 | 117.5 | 120.3 | 118.5 | 118.9 | 116.2 | 119.3 | 116.6 | 119.7 | 115.1 | 119.0 | 113.2 | 122.9 | --- | 114.1 |
| 06/17/2008 | 104.9 | 122.8 | 110.9 | 118.0 | 115.4 | 118.9 | 117.5 | 120.9 | 114.3 | 118.9 | 114.7 | 119.8 | 113.4 | 118.7 | 112.8 | 123.6 | --- | 115.8 |
| 06/18/2008 | 104.4 | 123.3 | 113.5 | 122.3 | 115.2 | 122.8 | 115.6 | 121.5 | 114.5 | 122.1 | 112.6 | 121.4 | 116.4 | 119.8 | 114.5 | 124.5 | --- | 120.0 |
| 06/19/2008 | 105.0 | 123.6 | 117.4 | 120.7 | 122.3 | 122.7 | 119.3 | 121.7 | 115.6 | 120.1 | 111.9 | 119.5 | 115.1 | 119.7 | 118.1 | 123.8 | --- | 120.6 |
| 06/20/2008 | 106.1 | 122.0 | 119.9 | 118.2 | 121.3 | 120.2 | 121.1 | 119.5 | 118.6 | 120.0 | 112.5 | 119.4 | 113.8 | 118.8 | 118.8 | 124.5 | --- | 120.1 |
| 06/21/2008 | 106.1 | 122.0 | 120.3 | 117.7 | 119.8 | 119.5 | 119.8 | 120.2 | 117.1 | 119.3 | 116.1 | 119.6 | 114.6 | 118.8 | 117.4 | 121.8 | --- | 119.1 |
| 06/22/2008 | 105.1 | 123.6 | 118.5 | 119.0 | 117.5 | 119.9 | 117.1 | 120.4 | 115.8 | 118.7 | 116.0 | 120.1 | 115.2 | 119.0 | 114.1 | 122.6 | --- | 116.3 |
| 06/23/2008 | 105.1 | 122.7 | 117.8 | 119.8 | 119.5 | 120.2 | 116.9 | 119.4 | 115.0 | 119.0 | 115.3 | 117.2 | 114.4 | 118.5 | 114.6 | 120.2 | --- | 114.1 |
| 06/24/2008 | 105.4 | 121.9 | 118.6 | 119.0 | 119.4 | 119.6 | 117.5 | 120.5 | 114.0 | 120.6 | 113.7 | 118.7 | 113.8 | 117.9 | 114.3 | 122.7 | --- | 114.5 |
| 06/25/2008 | 105.9 | 119.8 | 119.3 | 118.7 | 119.8 | 118.5 | 118.5 | 121.8 | 114.4 | 119.5 | 112.6 | 118.9 | 113.9 | 118.3 | 114.7 | 124.0 | --- | 116.9 |
| 06/26/2008 | 105.8 | 119.4 | 118.8 | 122.3 | 118.5 | 119.7 | 118.1 | 121.5 | 114.0 | 119.5 | 111.6 | 118.5 | 111.8 | 117.6 | 112.9 | 121.6 | --- | 114.4 |
| 06/27/2008 | 104.9 | 117.9 | 117.1 | 121.4 | 120.1 | 119.3 | 118.1 | 119.1 | 114.6 | 119.8 | 113.3 | 119.5 | 115.2 | 118.9 | 115.0 | 124.0 | --- | 117.9 |
| 06/28/2008 | 104.8 | 116.1 | 115.4 | 115.0 | 122.2 | 119.5 | 119.4 | 118.4 | 117.3 | 119.4 | 113.7 | 119.4 | 116.8 | 120.3 | 118.1 | 124.6 | --- | 117.1 |
| 06/29/2008 | 105.4 | 108.2 | 115.7 | 114.8 | 120.2 | 119.4 | 119.6 | 118.8 | 119.1 | 118.8 | 115.2 | 119.2 | 115.8 | 119.2 | 120.0 | 123.6 | --- | 119.2 |
| 06/30/2008 | 105.5 | 111.3 | 114.2 | 116.6 | 117.1 | 119.2 | 119.6 | 118.2 | 119.1 | 118.5 | 118.1 | 119.1 | 116.1 | 119.0 | 117.2 | 122.8 | --- | 118.5 |
| 07/01/2008 | 104.9 | 112.8 | 111.0 | 113.5 | 116.5 | 119.3 | 117.4 | 118.6 | 117.2 | 118.7 | 117.2 | 117.5 | 115.1 | 119.0 | 114.1 | 121.3 | --- | 115.3 |
| 07/02/2008 | 104.8 | 108.3 | 108.9 | 118.8 | 116.3 | 119.1 | 116.1 | 119.0 | 116.8 | 118.5 | 117.2 | 118.0 | 116.6 | 119.1 | 116.2 | 122.0 | --- | 116.4 |
| 07/03/2008 | 105.4 | 108.6 | 110.8 | 118.2 | 115.7 | 117.9 | 116.6 | 118.6 | 117.2 | 118.5 | 116.3 | 118.4 | 114.9 | 118.3 | 115.5 | 122.7 | --- | 117.0 |
| 07/04/2008 | 105.5 | 108.4 | 108.5 | 112.3 | 116.2 | 116.7 | 115.4 | 117.1 | 116.9 | 117.9 | 114.5 | 117.9 | 113.1 | 116.7 | 113.3 | 120.6 | --- | 114.7 |
| 07/05/2008 | 104.0 | 108.4 | 107.0 | 111.7 | 114.0 | 115.5 | 114.2 | 115.7 | 115.3 | 115.9 | 112.7 | 116.0 | 113.4 | 117.6 | 113.4 | 118.9 | --- | 113.2 |
| 07/06/2008 | 102.9 | 108.4 | 106.4 | 110.8 | 111.6 | 115.4 | 113.9 | 115.5 | 113.8 | 114.7 | 110.5 | 115.1 | 111.3 | 115.6 | 112.7 | 117.5 | --- | 112.7 |
| 07/07/2008 | 101.8 | 108.7 | 106.4 | 111.3 | 110.9 | 113.8 | 113.4 | 115.3 | 113.3 | 118.1 | 109.6 | 117.0 | 111.0 | 116.2 | 110.6 | 118.3 | --- | 113.0 |
| 07/08/2008 | 102.6 | 109.3 | 106.8 | 115.1 | 110.2 | 114.0 | 113.0 | 114.9 | 113.4 | 119.1 | 110.2 | 116.9 | 111.9 | 116.6 | 113.1 | 119.4 | --- | 113.4 |
| 07/09/2008 | 103.1 | 109.2 | 107.8 | 111.2 | 110.9 | 114.3 | 114.0 | 115.8 | 114.2 | 116.7 | 111.6 | 118.4 | 113.1 | 117.2 | 114.8 | 119.0 | --- | 115.7 |
| 07/10/2008 | 102.8 | 109.1 | 108.2 | 111.4 | 112.6 | 114.4 | 114.3 | 115.3 | 114.2 | 113.9 | 110.9 | 116.3 | 112.0 | 115.7 | 112.8 | 118.2 | --- | 113.1 |
| 07/11/2008 | 100.8 | 109.5 | 108.5 | 111.6 | 110.4 | 115.3 | 112.4 | 114.4 | 112.7 | 116.8 | 111.2 | 115.7 | 112.5 | 117.2 | 110.5 | 117.6 | --- | 111.8 |
| 07/12/2008 | 101.5 | 110.2 | 109.4 | 115.3 | 109.2 | 115.5 | 112.0 | 113.5 | 112.0 | 117.0 | 113.0 | 115.5 | 112.9 | 117.9 | 113.1 | 117.7 | --- | 113.3 |
| 07/13/2008 | 100.5 | 110.4 | 109.3 | 114.5 | 110.6 | 115.4 | 113.4 | 114.9 | 112.0 | 116.2 | 113.8 | 115.8 | 113.6 | 117.4 | 116.3 | 117.4 | --- | 116.9 |
| 07/14/2008 | 100.1 | 110.2 | 107.8 | 110.9 | 112.0 | 116.1 | 113.8 | 115.6 | 113.2 | 116.8 | 112.4 | 116.3 | 113.4 | 117.0 | 115.5 | 116.9 | --- | 116.9 |
| 07/15/2008 | 100.9 | 110.9 | 110.2 | 110.9 | 113.4 | 114.8 | 114.1 | 113.7 | 113.8 | 115.4 | 112.0 | 115.7 | 113.6 | 116.8 | 113.8 | 116.4 | --- | 116.6 |
| 0 | 1 | 2 | 3 | 4 | 5 | 6 | 7 | 8 | 9 | 10 | 11 | 12 | 13 | 14 | 15 | 16 | 17 | 18 | 19 | 20 | 21 | 22 | 23 | 24 |
Monitoring Station List
Lower Granite Forebay LWG
Lower Granite Tailwater LGNW
Little Goose Forebay LGSA
Little Goose Tailwater LGSW
Lower Monumental Forebay LMNA
Lower Monumental Tailwater LMNW
Ice Harbor Forebay IHRA
Ice Harbor Tailwater IDSW
McNary Forebay MCNA
McNary Tailwater MCPW
John Day Forebay JDY
John Day Tailwater JHAW
The Dalles Forebay TDA
The Dalles Tailwater TDDO
Bonneville Forebay BON
Bonneville Tailwater CCIW
Warrendale WRNO
Camas / Washougal CWMW
learn more on topics covered in the film
see the video
read the script
learn the songs
discussion forum
